Bipin's Bubble
Probability 3: Structured Probabilistic Models
The chapter 2 of Deep Learning Book is focussed on Probability and Information Theory. This post is TLDR part 3 of the corresponding chapter of the book.
Background
- ML algorithms involve large number of random variables.
- Joint Probability distribution of these many variables is complex.
- Often, very few variables interact with each other directly.
- Using joint probabilities to describe everything is inefficient.
- Alternative: Factorizing joint probabilities into conditionals of interacting variables.
- Advantage: Less number of parameters
- Efficient representation
- Can be represented as graphs called: graphical models
- Recall: Graphs: set of vertices connected to each other with edges.
- A graph $G$ with set of vertices $V$ and edges $V_{i,j}$
- Can be directed or undirected.
- Probabilities can be represented as graphs: directed or undirected.
- Each node corresponds to a random variable.
- Edges between nodes represent the direct interaction between the random variables represented by those nodes.
Directed Graph models
- Graphs with directed edges
- They represent factorizations into conditional probabilities
- Contains one factor for every random variable $x_i$ in the distribution (one vertrex for each random variable)
-
That factor consists of conditional distribution for over $x_i$ given parents of $x_i$ denoted as: $P_{a_G}(x_i)$
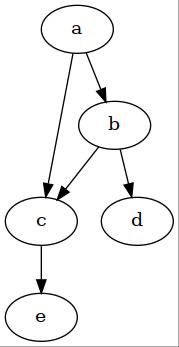
\[p(\mathbf{x}) = \underset{i}{\operatorname{\prod}} \ {p(x _i \ \vert \ P_{a_G}(x_i))}\] - Example:

In the above directed graph, the joint probability of random variables: $a,b,c,d,e$ can be written as:
\[p(a,b,c,d,e) = p(a) p(b \vert a) p(c \vert a, b) p(d \vert b) p(e \vert c)\]Undirected Graph models
- Factorize joint into functions, instead of conditionals.
- Set of nodes connected to each other in graph $G$ is called clique
- Each clique $C^{(i)}$ is associated with a factor $\phi^{(i)}(C^{(i)})$
- These factors are functions and not probabilities.
- Output of these functions must be non-negative.
- If they were probabilities as in directed, they would also integrate to 1.
- Probability of any configuration is proportional to product of all these factors.
- The proportanility is converted to equality by a normalizing constant that ensures that the total probability sums to one.
- Example:

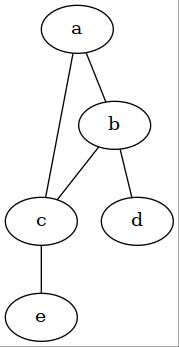
In the above undirected graph, the joint probability of random variables: $a,b,c,d,e$ can be written as:
\[p(a,b,c,d,e) = \frac{1}{Z} \phi^{(1)}(a,b,c) \phi^{(2)}(b,d) \phi^{(3)}(c, e)\]Notes
- Graphical models are just different ways of representing the probability representations.
- The choise of method is not mutually exhaustive: different representations can be used for representing the same thing in different ways.
- Same probability distribution can be represented as directed as well as undirected depending on the situation.
September 25th, 2020 by Bipin Lekhak
Feel free to share!